Dog bites across NYC
We were interested to know how the raw counts of dog bites compared to the number of registered dogs; if there are more pit bull bites, does that mean that pit bulls are more aggressive and likely to bite than other breeds, or is it simply that there are more pit bulls in the city?
If we assume that no dog bites twice, and all dogs that bite are licensed, then across all boroughs, 2.09% of licensed dogs bite. By borough, it breaks down as follows:
| Borough | No. Licenses | No. bites | Percent |
|---|---|---|---|
| Manhattan | 42507 | 530 | 1.25 |
| Brooklyn | 30271 | 598 | 1.98 |
| Queens | 25109 | 664 | 2.64 |
| Bronx | 12585 | 486 | 3.86 |
| Staten Island | 11146 | 264 | 2.37 |
A higher percentage of licensed dogs bite in the Bronx than any other NYC borough; Manhattan has the lowest percentage of total dog bites. However, Manhattan has the most licensed dogs by quite a bit, whereas the Bronx has the second fewest number of registered dogs. Queens has the highest number of reported bites (664 total).
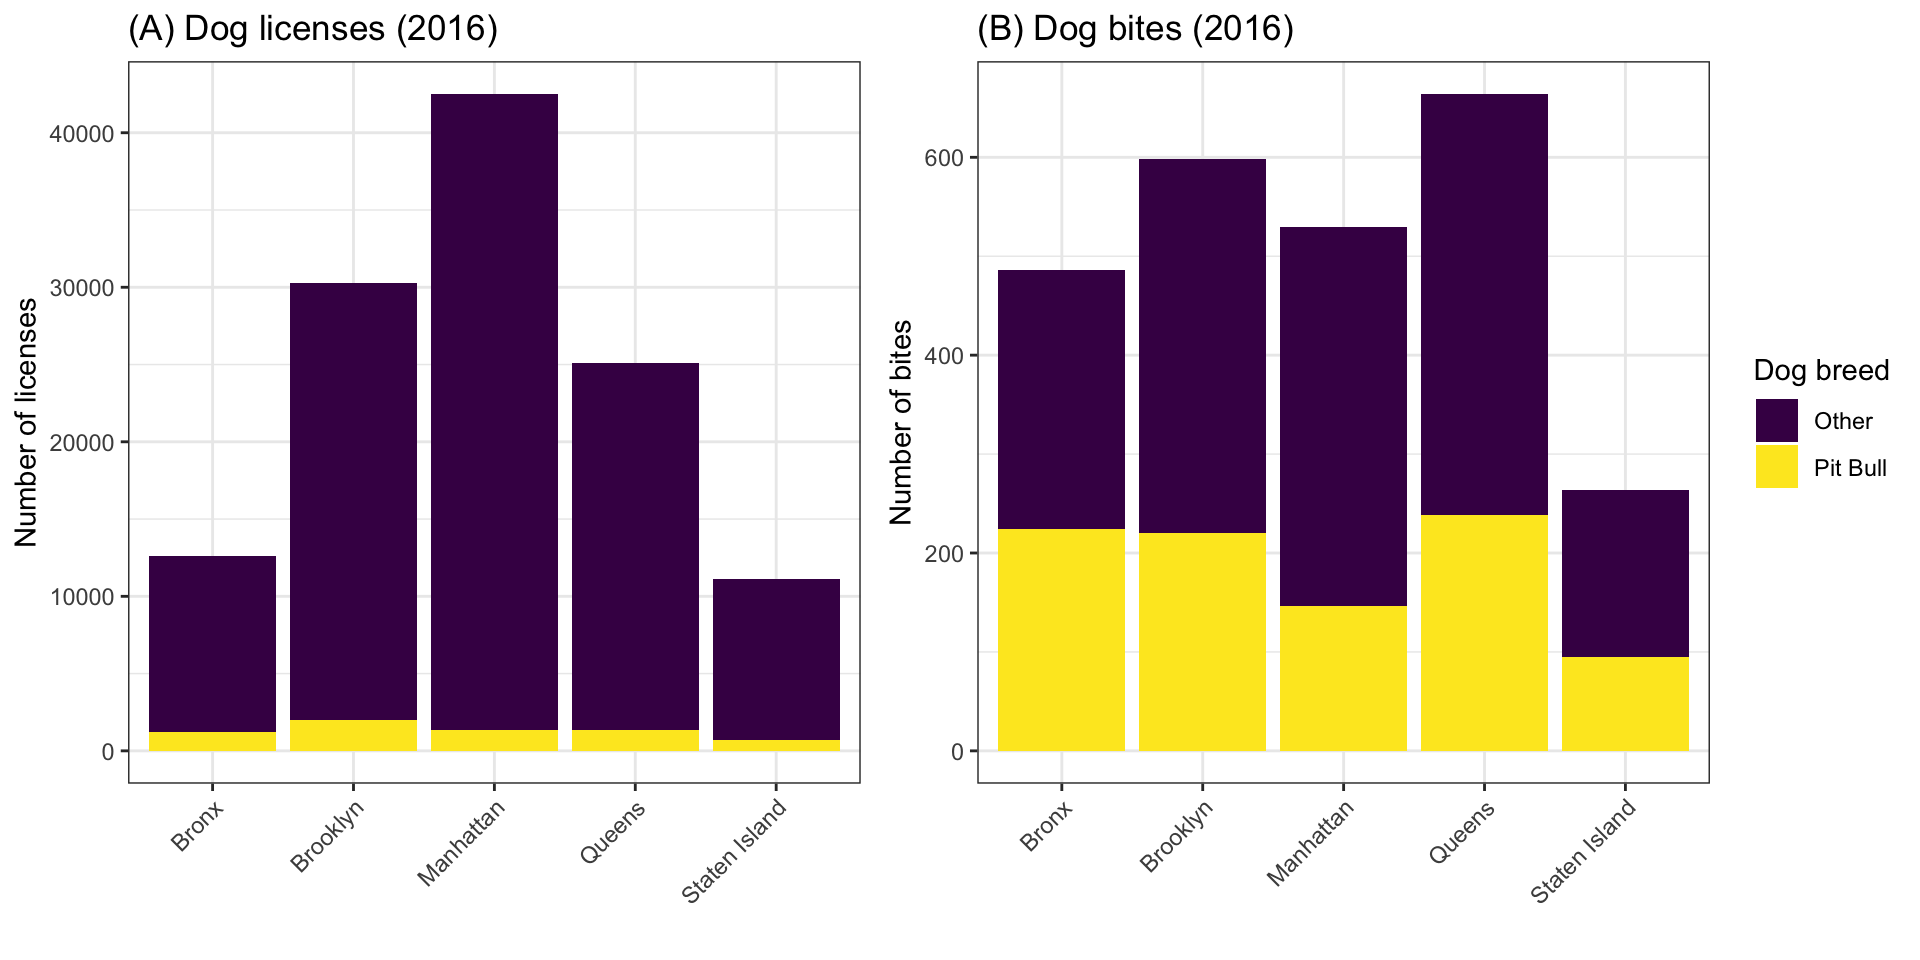
We can break this analysis down by dog breed; pit bull or not. Across all years, only 5.52% of registered dogs are pitbulls. However, 32.57% of all bites are given by pitbulls; in 2016, this number was 35.74%.
The figures below show the number of registered dogs and number of bites by borough, and classified by breed type. The overall trend described above is upheld. A small percentage of licensed dogs are pit bulls (A), but upwards of 30% of all reported bites are given by pit bulls (B).